Wazuh SIEM + Windows EventChannel alert triage in VirtualBox
I created a Windows account, deleted it, and followed the evidence into Wazuh. I caused the “incident” myself; the point was to see whether I could reconstruct it from the alerts.
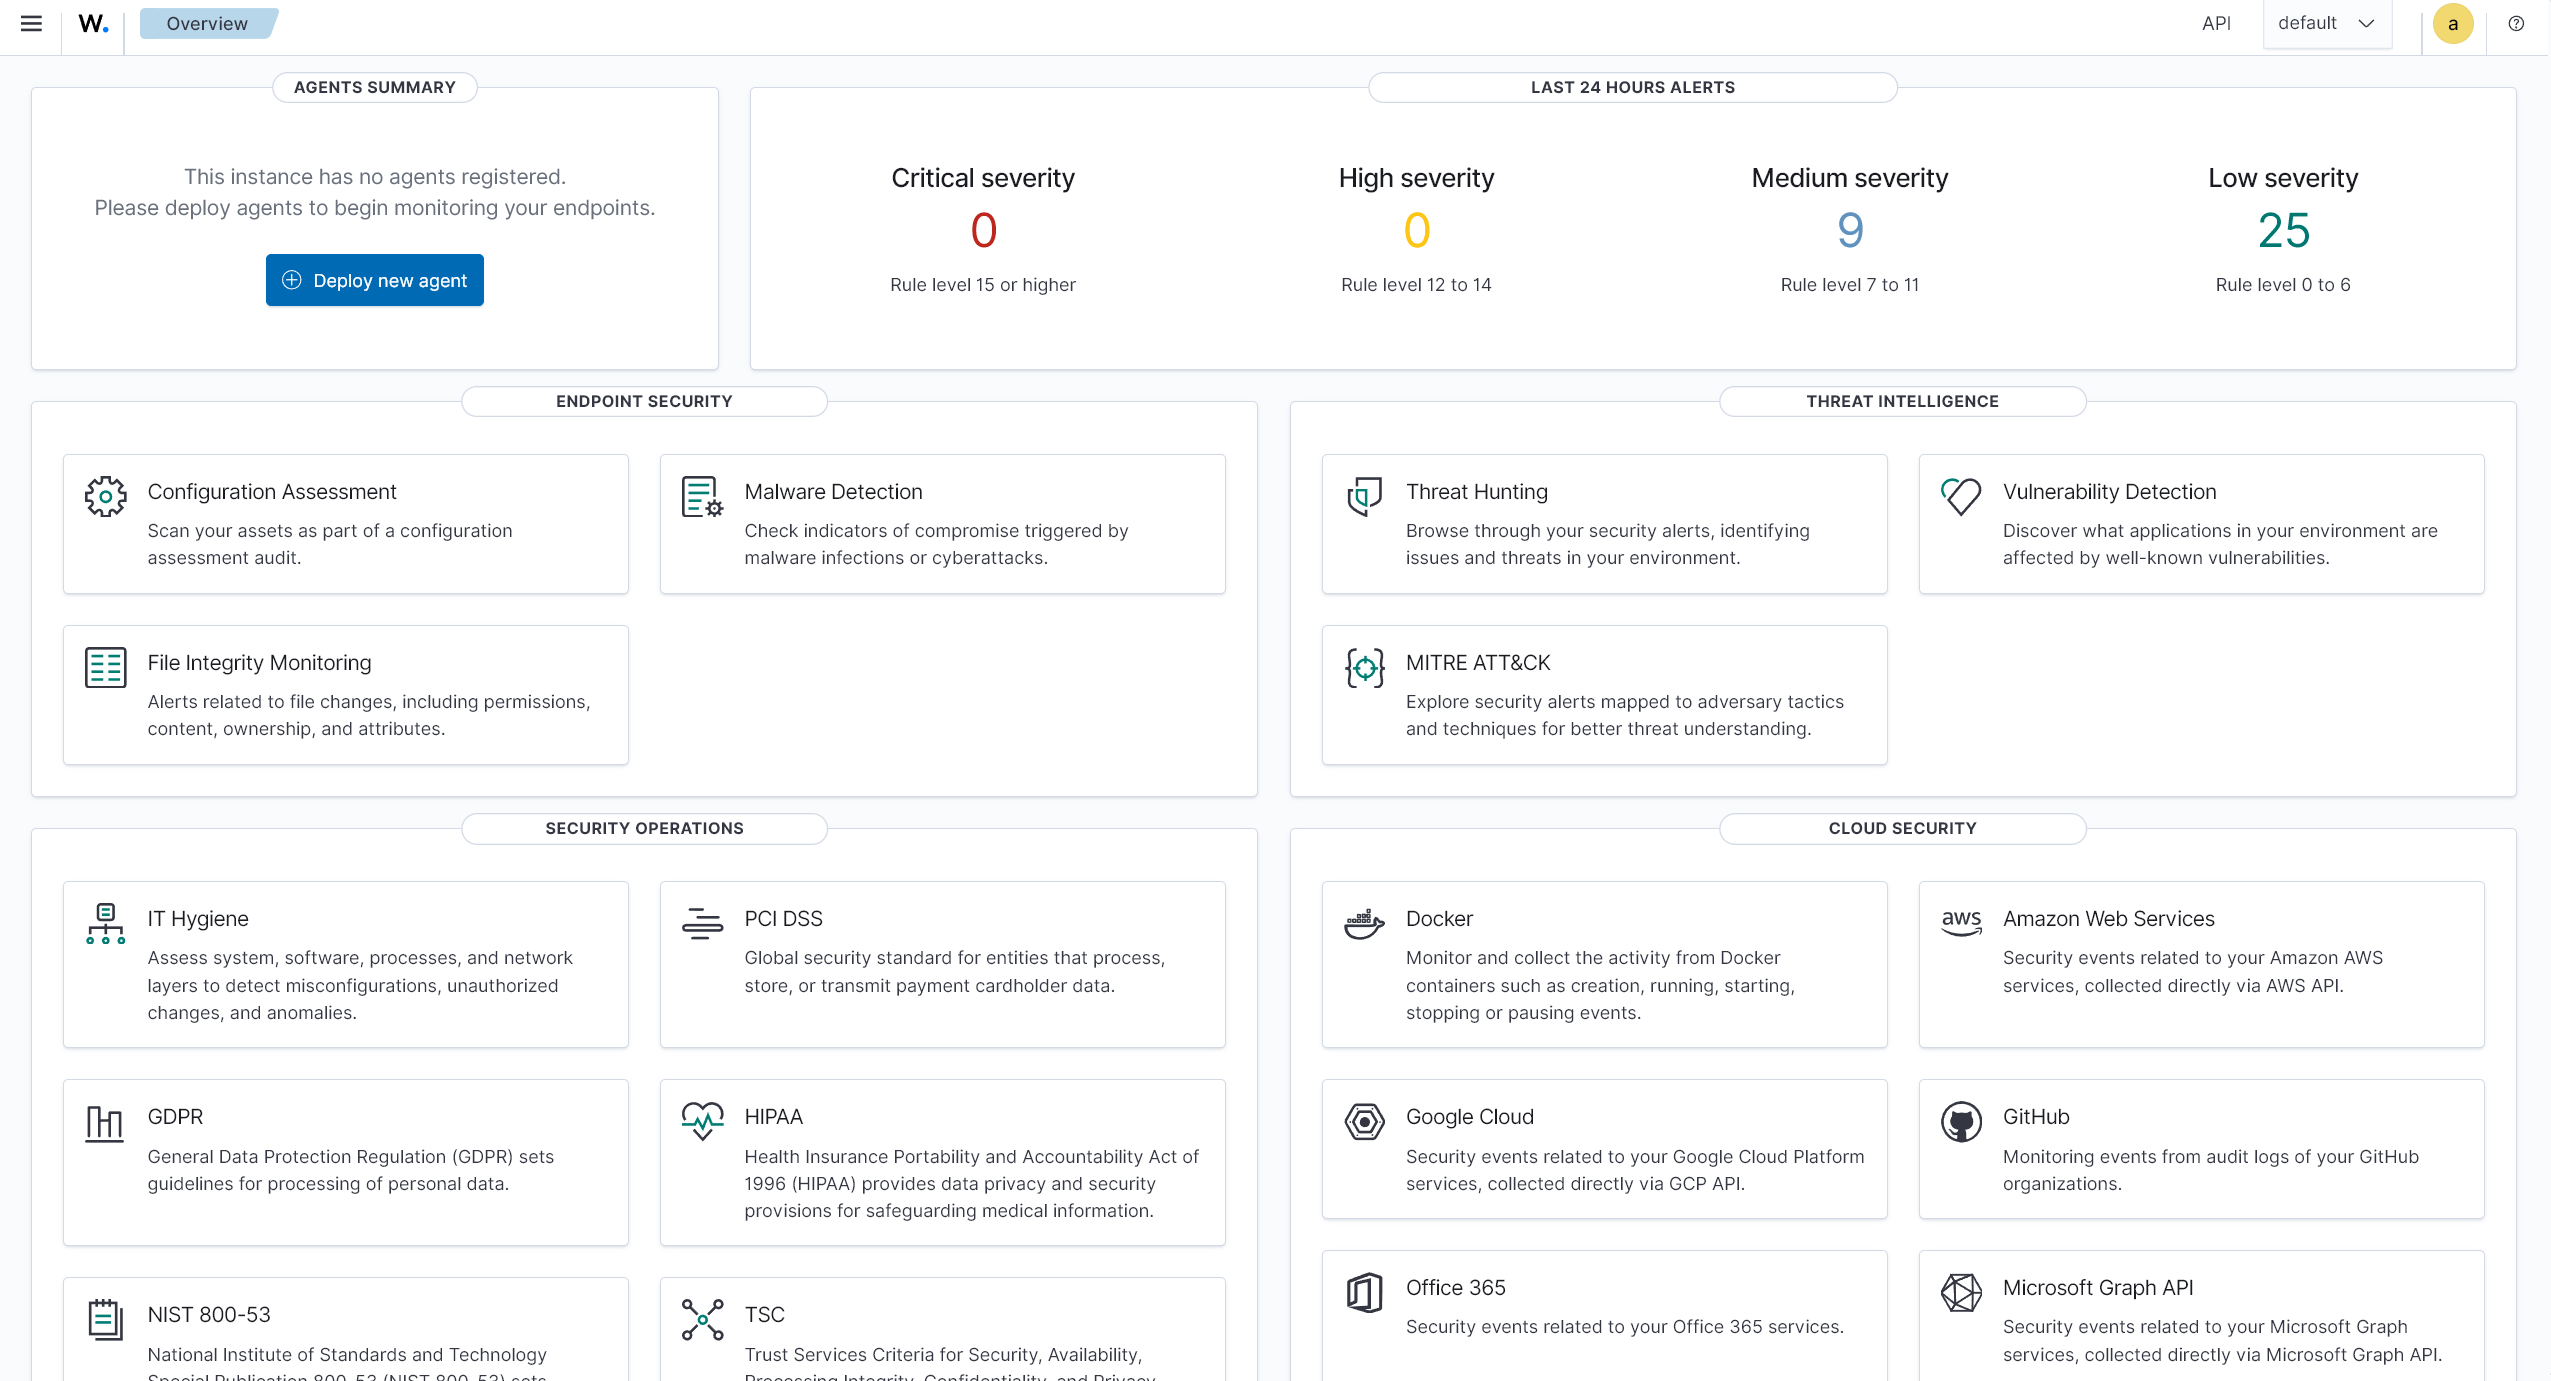
I installed the Wazuh manager in VirtualBox, connected a Windows test endpoint, and verified that the agent service was running with the required administrator permissions.
The question was intentionally small: can I turn one known action on the endpoint into searchable evidence, then explain what happened without leaning on the fact that I already know the answer?
This is a lab, not a breach story
I own the environment and generated the activity on one Windows test endpoint. This is hands-on monitoring practice, not production SOC experience or an external attack.
Lab managerWazuh running in an isolated VirtualBox environment
02 / Data path
From a Windows action to a searchable alert
01Controlled Windows action
Create, enable, change, disable, and delete a local test account on the endpoint.
02Endpoint event collection
The running Wazuh agent forwards relevant Windows EventChannel data to the manager.
03Wazuh search and triage
Filter by endpoint, event sequence, rule description, level, and rule ID to reconstruct what happened.
03 / Test
Generate known account activity
I created and later removed a local test user. Wazuh recorded the surrounding account and group changes, including “User account enabled or created,” “User account changed,” and “User account disabled or deleted.”
One alert did not tell the story. The endpoint, order of events, rule descriptions, and nearby group changes did. Because I generated the activity, the final disposition was expected and benign.
Collection evidence
Account and group-change events arrived under the expected test endpoint with the corresponding Wazuh rule descriptions and severities.
Evidence boundary
The screenshot is sanitized and excludes account credentials and internal network configuration.
Collected evidenceSanitized event view; scroll horizontally on small screens
04 / Investigation
One alert is a clue, not a conclusion
Observed event
A local account was enabled or created on the Windows test endpoint during the controlled exercise.
Initial decision
Expected and benign because the account was created for this controlled test.
Why a SOC caresUnexpected accounts can create persistence
A new local user deserves context, especially if it receives elevated group membership.
What to correlateActor, groups, and later logins
Identify who created it, whether it joined Administrators, and whether authentication followed.
What evidence provesThe collection path worked
The endpoint action appeared under the correct host with related account and group events.
05 / Boundaries
What I did—and what I haven’t done yet
I deployed Wazuh, connected the agent, generated account activity, searched the resulting events, and made a basic triage decision. I have not yet built a Sysmon-to-Wazuh ingestion or detection pipeline, written custom detections, mapped the activity to MITRE ATT&CK, or produced a full incident report.
During CyberSummer, I separately installed Sysmon and inspected its telemetry directly in Windows Event Viewer. That practice is distinct from the Windows EventChannel collection demonstrated here.
Next, I want to ingest a Sysmon process-creation event, reproduce the setup from memory, and correlate it with a Windows account event in one structured investigation.
06 / Result
I could follow the event end to end
The account action appeared under the correct endpoint with the related account and group events. From there, I could explain what happened, why it was expected, why the same alert could matter in production, and what I would check next.